'%20fill='%23FB923C'/%3e%3c/svg%3e)
Functions/Kliva Pipeline
Your workspace for everything
A flexible workspace where you manage properties in one place — with seamless collaboration across transactions, asset management, sustainability, and more.
From signal to deal
Connected to the Property Graph — Signals become cards with one click
Pipeline is connected to the Property Graph. A Signal — an ownership change, a new detailed development plan, a transaction in your monitored area — becomes a card with one click. All data from the graph is pre-filled. No manual lookups, no copy-paste.
Kliva Pipeline
Structure, analysis, and collaboration — on your terms.
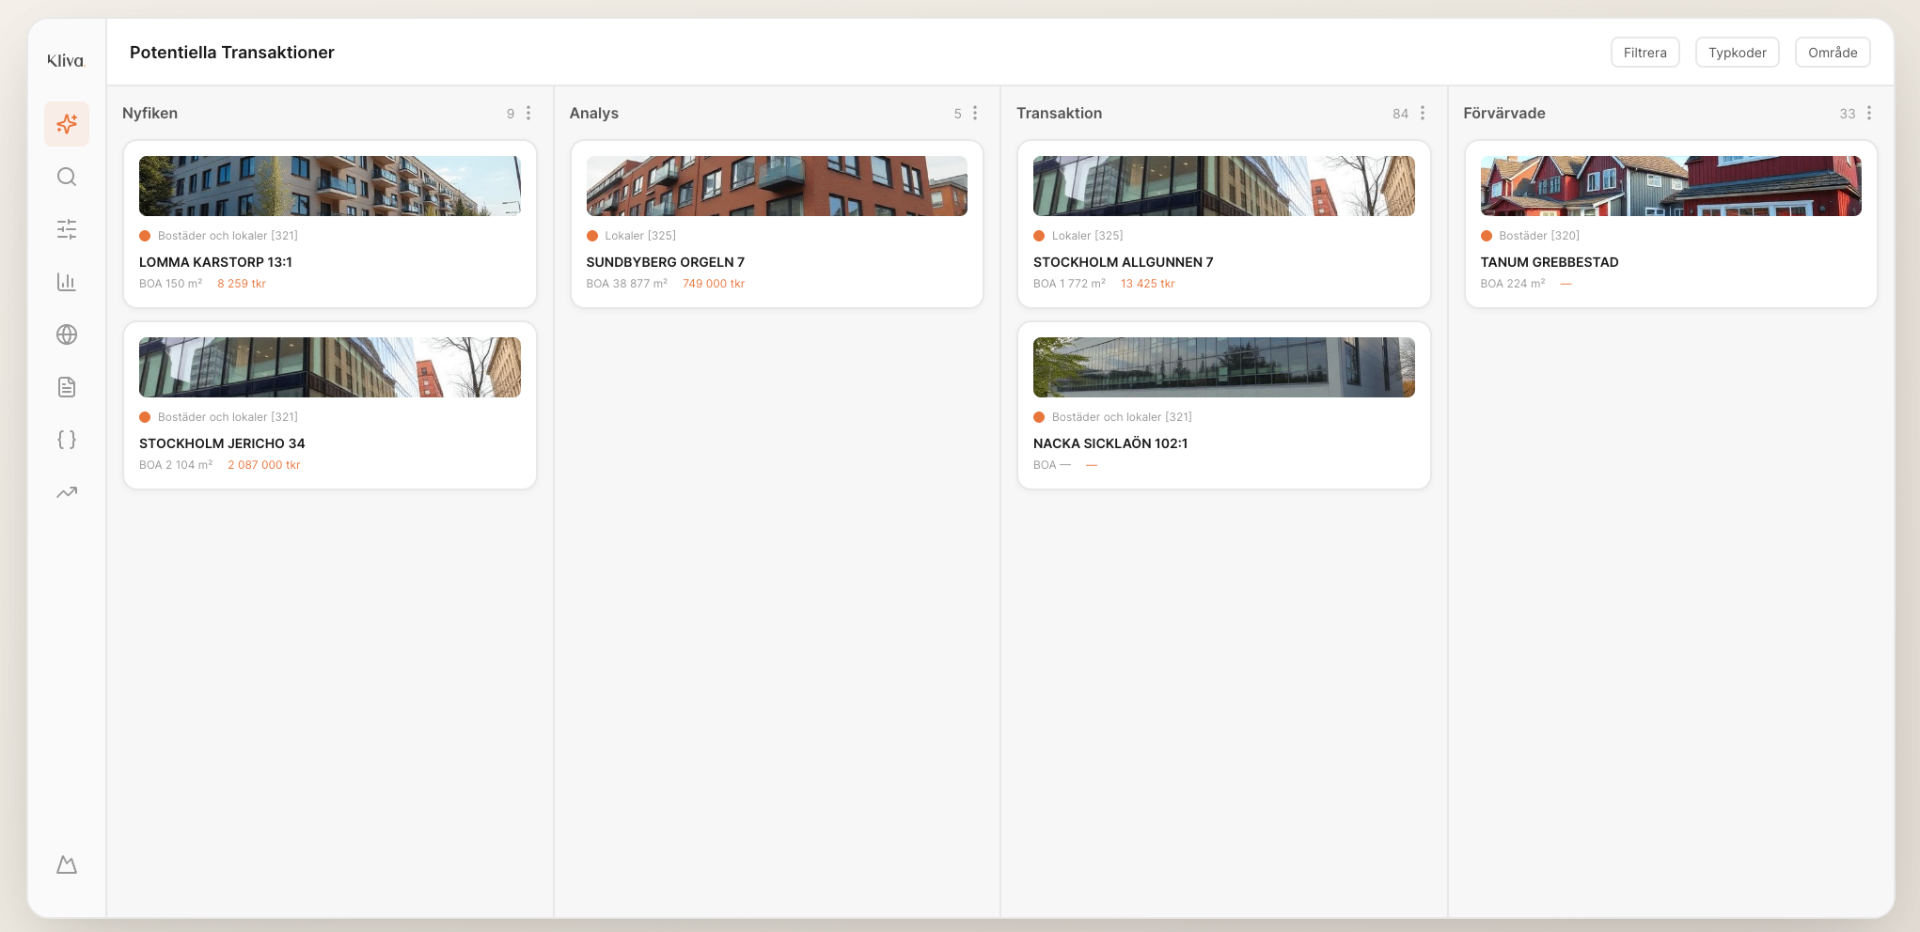
Move properties and projects through your process steps in an intuitive Kanban flow. The entire team gets an instant status overview — where each deal or project stands, right now.
Kliva Pipeline is not just a place to collect properties — it is an active, visual workflow for analysis, collaboration, and faster business decisions.
- Simple and informative Kanban flow for properties and projects
- Customize the view with lists, tags, notes, and activities
- Import properties from Excel — structured in seconds
- Visualize properties, projects, and market areas on the map
- Advanced cash flow and environmental risk analysis per asset
- Visualize your entire portfolio on the map — color-code by tags or list, filter with AND/OR logic
- Work in table or list view to complement the Kanban flow
- Add your own comments and notes on every card
- Upload documents directly to the property or project
- Private view or seamless team workflow — you choose
Quick Import
Do you have a list of property designations?
Upload it and let Kliva retrieve data. In seconds, you can export all important information — quickly and easily.
What you get
All key information, gathered in one feed
Kliva Pipeline kopplar ihop data och analys så att teamet kan gå från insikt till beslut med mindre handpåläggning.
Map view with tag filtering and color coding per list
View the entire portfolio on the map, color-coded by tags or list — with AND/OR filtering for quick analysis.
Table and list view for a structured workflow
Switch between Kanban, table, and list view depending on the task.
Customizable views and pipelines
Build your own process — customize columns, stages, and views to match your team's workflow.
'%20fill='%23FB923C'/%3e%3c/svg%3e)